

Your Forecast Isn’t Just Wrong.
It’s Quietly Costing You Millions.
Most companies track forecast accuracy.
Very few quantify its impact on margin, inventory, and revenue.
This tool turns your forecast error into real financial exposure—in under 4 minutes.
Built on industry benchmarks across inventory, stockouts, and operational cost.
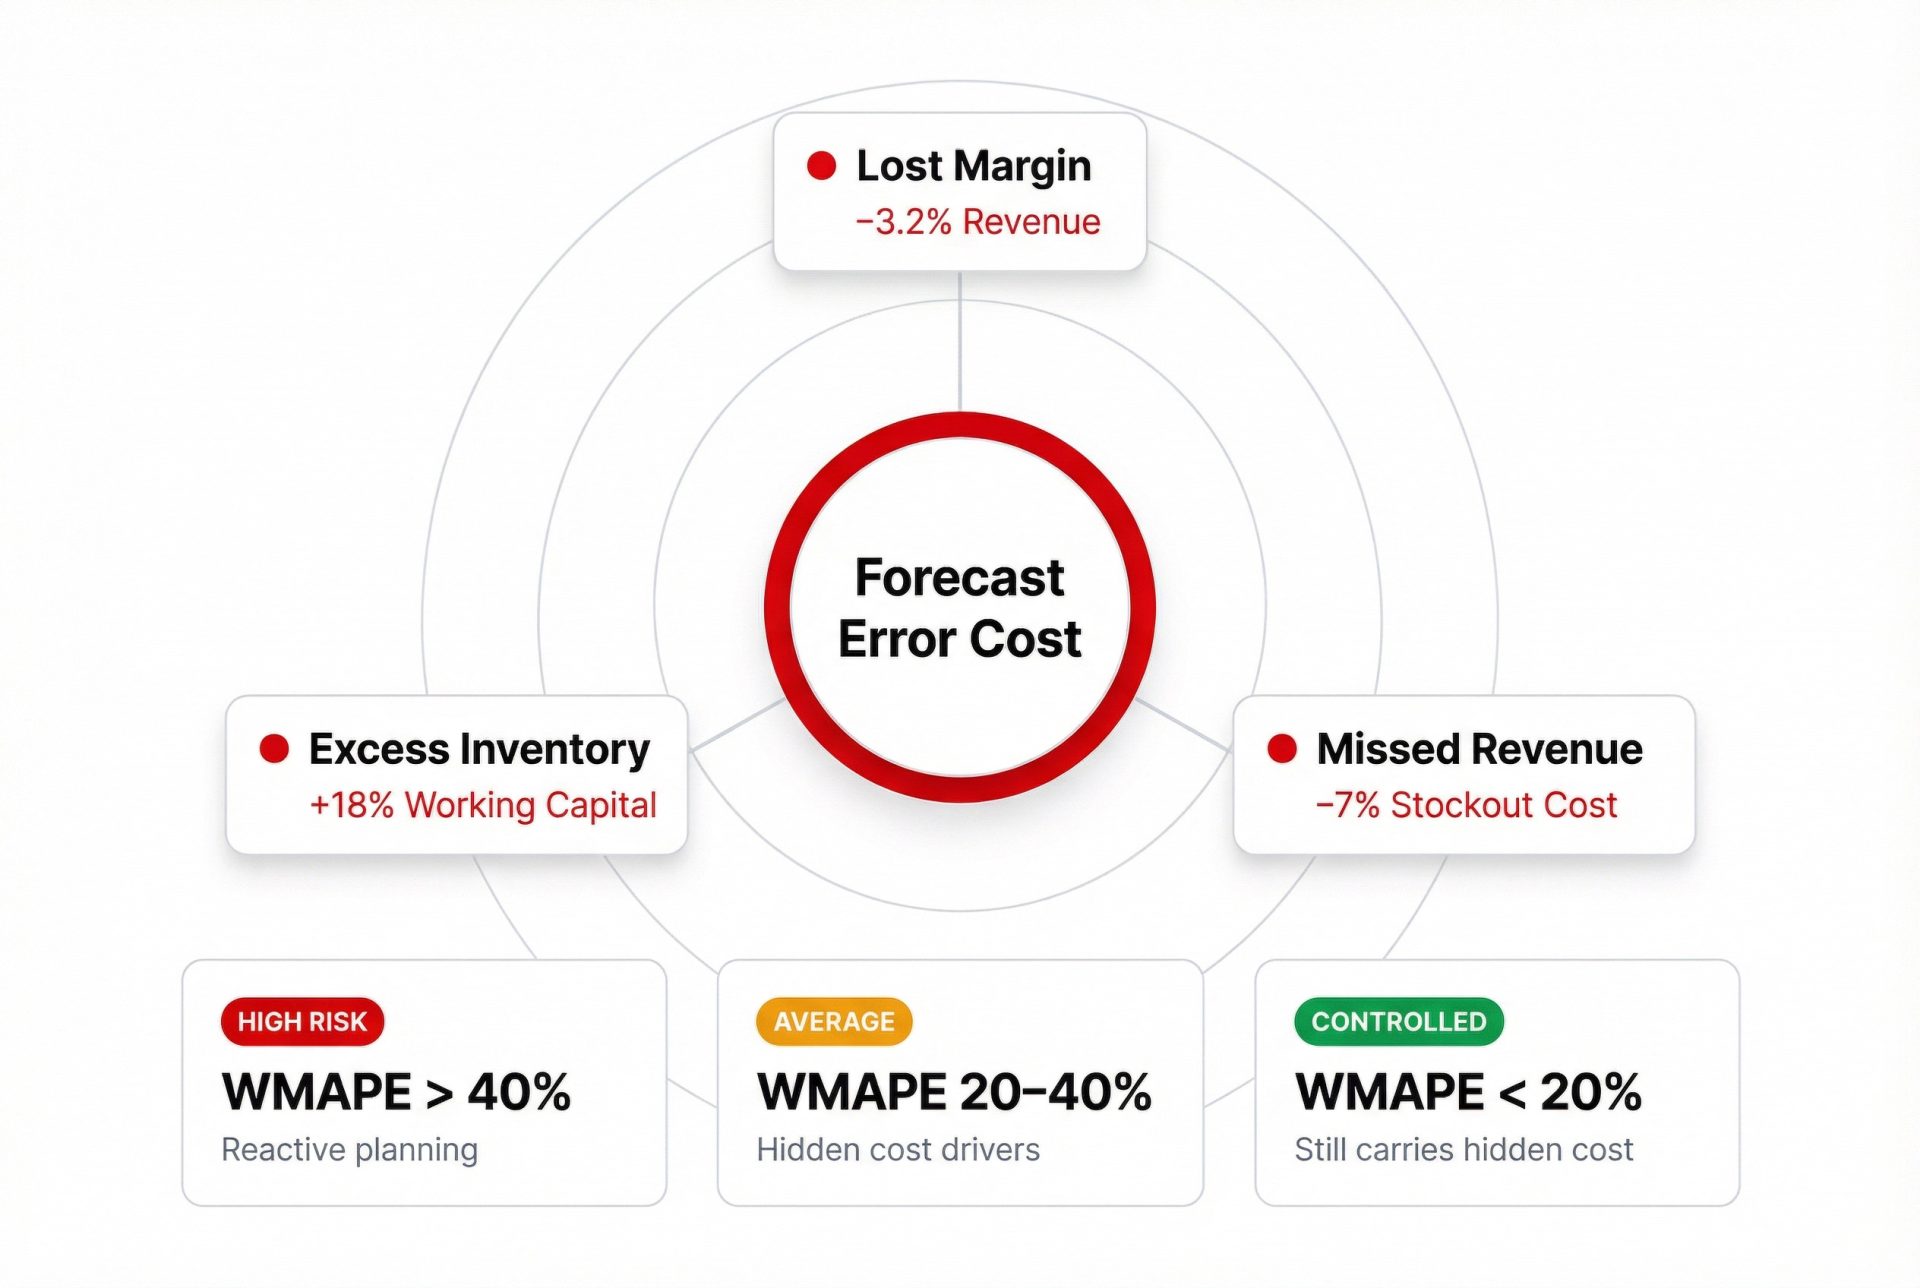
Forecast Accuracy Is Not a KPI. It’s a Financial Leak.
Most companies track forecast accuracy as a percentage.
- 10% error
- 20% error
- 40% error
But those numbers don’t drive action.
Because they don’t show:
- how much working capital is trapped in inventory
- how much margin is lost in stockouts
- how much operational cost is created downstream
Forecast error is not a planning issue.
It is a profit and cash flow problem.
Quantify the Cost — Not Just the Error
This calculator converts forecast inaccuracy into financial impact using:
- your revenue and margin structure
- your planning lead times
- industry-calibrated cost drivers
You can either:
- upload your actual forecast vs actuals
- or run a fast estimate based on your confidence level
→ No setup. No data integration. Immediate output.
What Your Result Actually Means
Your forecast is in the high-risk zone.
At this level:
- inventory buffers increase significantly
- stockout probability rises sharply
- planning becomes reactive
This is not a forecasting issue. It’s a structural planning problem.
You are operating in the industry average range.
This typically means:
- some categories are predictable
- others are driving disproportionate cost
The opportunity is not improving everything — it’s isolating where the error is expensive.
You are within a controlled range.
However:
- Even at this level, most companies still carry hidden cost
- because error is not evenly distributed
How You Compare
Best-in-class manufacturers operate below 10% error
and contain the cost of inaccuracy to 1.5–2.5% of revenue
If you are above that range:
You are not just less accurate —
you are structurally overpaying for uncertainty.
The Hidden Truth Most CFOs Miss
Forecast error does not hurt evenly.
The majority of financial impact usually comes from:
- a small number of SKUs
- specific time horizons
- constrained parts of the supply chain
This is why improving average accuracy alone rarely delivers ROI.
You need to understand:
- where the error is costly
- and whether it is preventable
This Is a Directional Estimate
This tool gives you a modeled estimate based on benchmarks.
A diagnostic goes further.
It identifies:
- which cost category is driving your exposure
- where forecast error is concentrated
- whether the issue is structural or fixable
Most companies underestimate their cost of inaccuracy by 30–50%.
Fixed scope. 5 days. No implementation required.
What Happens Next
The diagnostic is not a system implementation.
It is a structured analysis of:
- your demand patterns
- your planning process
- your financial exposure
You leave with:
- quantified savings opportunity
- clear root causes
- prioritised actions
FAQ
Do I need historical data?
→ No
Is this accurate?
→ Directional, calibrated with benchmarks
What industries does this apply to?
→ Manufacturing / supply chain heavy businesses
How long does the diagnostic take?
→ 5 days